The obvious flaws in AGW theory
How climate change propaganda is destroying Canada
It is at least 50 years since the first “climate change” alarms emanated from the United Nations, first claiming a “new ice age” was imminent followed by doomsday predictions of “global warming” all of which were laid at the feet of rising levels of CO2 in the atmosphere. Canada under Justin Trudeau is “all in” on this alarm taking steps to cap emissions and planning to phase oil & gas out completely during his tenure as Prime Minister.
The climate change doomsday predictions are all based on a plethora of charts, graphs, correlations, models, and papers written by scientists and published by the Intergovernmental Panel on Climate Change (IPCC). The alarm has so much support world leaders gather annually to discuss ways to stem the rise in CO2 emissions without much concern that the Anthropogenic Global Warming (AGW) theory has some obvious flaws. There is one chart that has what may be the most convincing evidence that CO2 is a “greenhouse gas” and does interact with CO2 (as does water vapor, methane, and other trace gases) slowing the escape of Long Wave Infrared Radiation from Earth’s surface to space. It is that phenomenon which is the underpinning of the AGW theory and all scientific papers arguing there is a serious threat derive from it one way or another. Here is the chart.
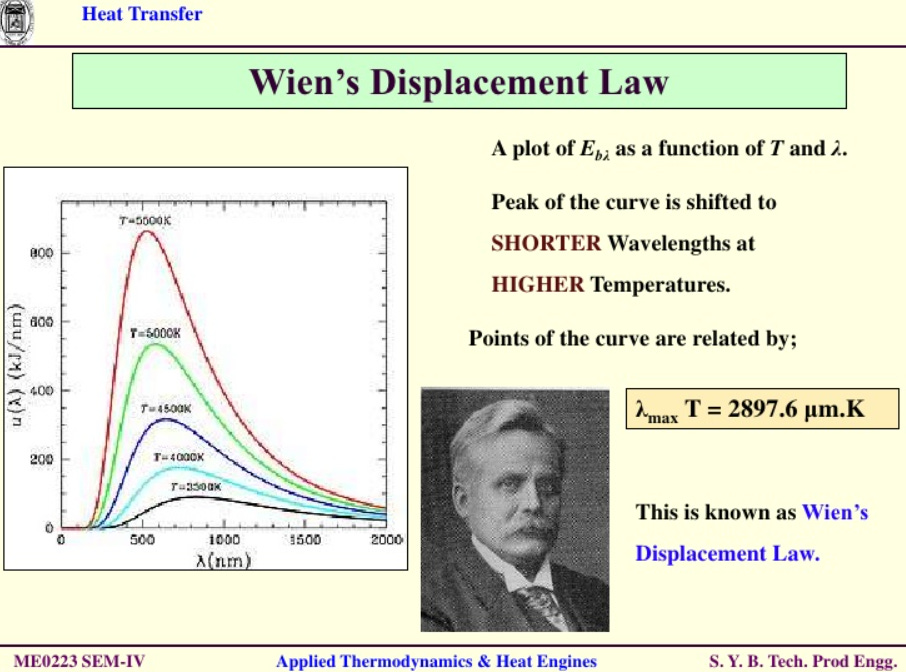
The chart is satellite based measurement of LWIR seen at the top of the atmosphere compared to smooth curves of the expected chart of such radiation based on Planck’s theory (the MODTRAN Model), with curves shown for a range of surface temperatures from 220 degrees Kelvin to 320 degrees Kelvin (recall that the Kelvin scale is identical to the Celsius scale with 273 degrees added) measuring. Before discussing the chart of empirical data it is helpful to see a similar chart as it theoretically should appear with the vertical axis showing implied spectral radiance in Kilowatts per meter squared per nanometer of wavelength and the horizontal chart wavelengths in nanometers. Each curve is for a particular temperature from 7,000 degrees Kelvin down to 3,000 degrees Kelvin.
The empirical data from the IRIS Satellite measurements differs in that it is expanded in temperature ranges typical on Earth rather than those typical of the Sun’s surface in the colorful theoretical chart, and is compared to the theoretical data that the MODTRAN model (which incorporates the global warming theory) produces. I will call this the MODTRAN chart.
On the MODTRAN chart, the horizontal axis is “wavenumber” which is the reciprocal of wavelength and the vertical axis is energy per meter squared for each unit of wavenumber. These symbols confuse many but are typically used in comparing energies when dealing with spectra. For the purposes of this article, they are irrelevant as you will see, but will be useful in completing the assignment at the end of this article.
Looking at the MODTRAN chart there is a visible drop in the measurements between wavenumbers 400 to 800, and the chart is labeled to identify this as a range of LWIR which interacts with water vapor and CO2. It is the evidence that there is a “greenhouse effect” and the dimensions of that effect are the amount of LWIR delayed on its trip to space by interactions with the particular “greenhouse gases”. The scale of the vertical axis goes from zero to 200, and for simplicity I will just call these “units of energy”. The chart shown was measured when CO2 concentrations were 320 ppm of atmosphere.
The MODTRAN chart shows the horizontal scale at the top of the chart in “wavelengths” measured in microns so a reader is not forced to convert “wave number” to “wavelength” if desired. LWIR interacts with CO2 in a very limited band of wavelengths centered at 15 microns.
It has taken quite a while to get to the point of this article, which by now should be clear. The MODTRAN chart shows clearly that at 320 ppm of atmospheric CO2 approximately 70% of the outgoing LWIR has interacted with water vapor and CO2 in their respective wavelengths. That decline can never exceed 100%, the point at which all outgoing LWIR capable of interacting with these “greenhouse gases” has been “absorbed” to use a term alarmists frequently use to describe the phenomenon.
At a CO2 concentration of 320 ppm, Earth had already experienced any rise in temperature potentially associated with the “absorption” of 70% of outgoing LWIR in the bandwidth associated with CO2. Even if our atmosphere were solely comprised of CO2 the “absorption” of outgoing LWIR in the 15 micron wavelength would never exceed 100% and the effect of any level higher than 320 ppm (like today’s 417 ppm) would have little effect on temperature on any theory of the case. In a word, any effect CO2 has on temperature is already virtually “saturated”.
Anyone can run simulations on the MODTRAN model, and by doing so get an estimate of the change in outbound LWIR for differing concentrations of CO2 in the atmosphere using the latest modeling technology. I will show you three:
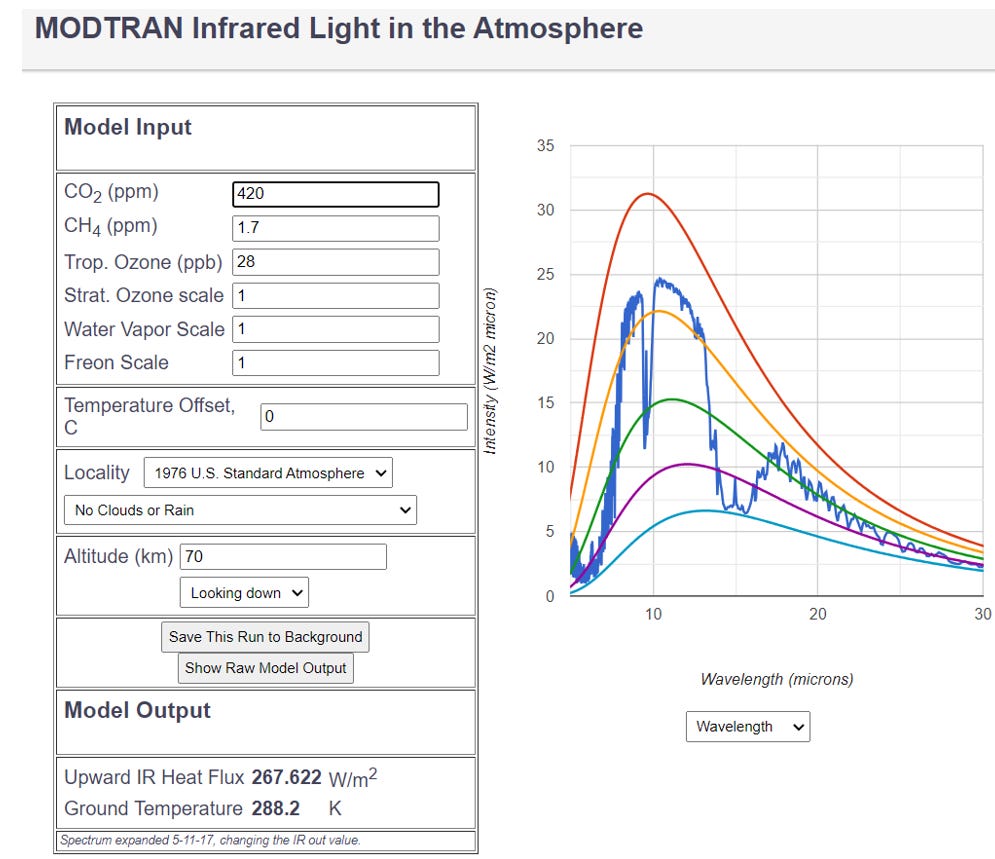
MODTRAN Model with zero CO2 in atmosphere (I call this the NetZero model or more colloquially, the end of life on Earth model). If atmospheric CO2 were at zero, the outgoing LWIR in the 15 micron wavelength would be approximately 15 Watts per meter squared per micron.
MODTRAN Model at 420 ppm CO2 (today’s Mauna Loa reading so I call this the Mauna Loa model). Note that outgoing LWIR in the 15 micron wavelength has dropped to approximately 7.5 watts per square meter per micron, a drop of about 50%.
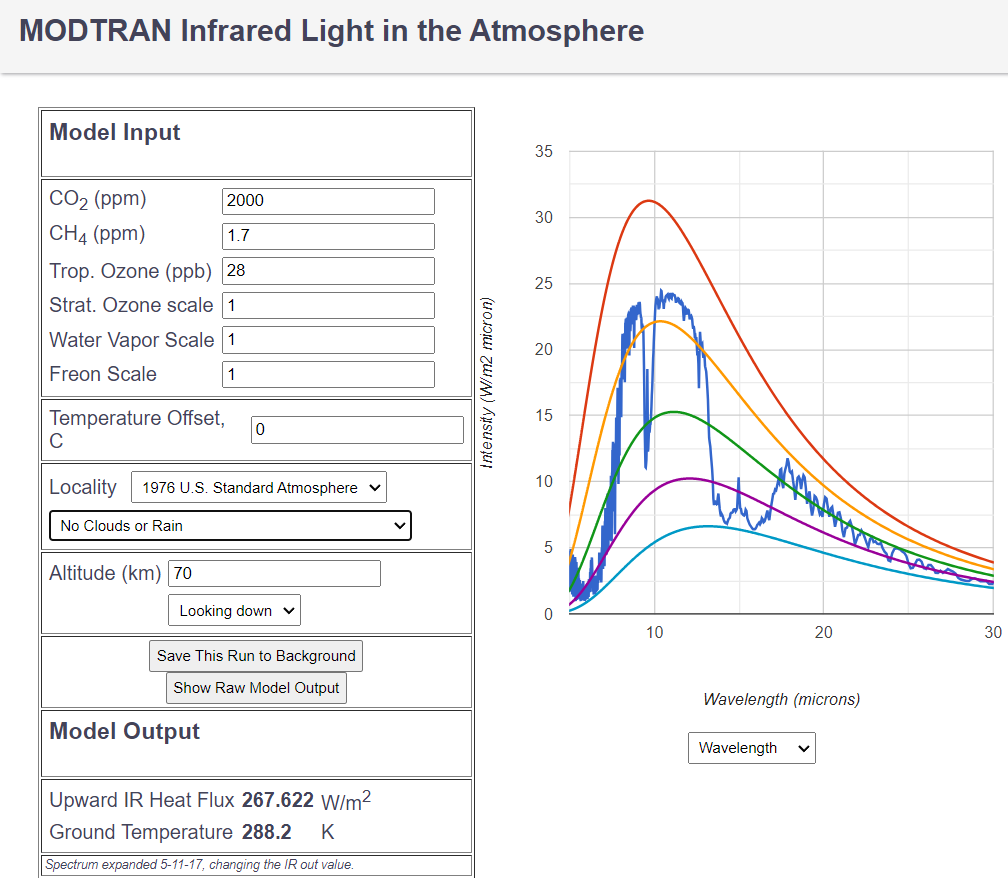
MODTRAN Model at 2,000 ppm CO2 (the Alarmist Doomsday model, since 2,000 ppm cannot be achieved even with combustion of all fossil fuels known to exist on Earth, but is still included as a possibility in many IPCC papers claiming doom and gloom from CO2 emissions). Note that outgoing LWIR in the 15 micron wavelength remains at approximately 7.5 watts per square meter per micron. The point is that any so-called “greenhouse effect” of CO2 is saturated now and even emissions raising CO2 levels to 2,000 ppm. will have no material effect on outgoing LWIR. Were that even possible, no additional heat would “be trapped” and global temperatures would vary solely in ways unrelated to CO2 emissions.
The point is that the models produced by the IPCC and the “MODTRAN”, “Mauna Loa” and “Alarmist Doomsday” models together confirm that no material “warming” will happen with higher emissions. You can safely conclude “global warming” really means “global socialism” and is unrelated to emissions.
Not only is any effect of CO2 saturated but also is nominal in the first place. Wien’s Law demonstrates that LWIR from a surface peaks at a temperature given by the formula 2898/wavelength where the answer is in degrees Kelvin. For 15 micron LWIR that produced 2898/15= 193 deg. Kelvin or - 80 degrees Celsius. Little of Earth’s surface is ever that cold and very little 15 micron LWIR is radiated from Earth.
The theory of CO2 radiative warming of the atmosphere was dismissed by Einstein in a 1917 paper. Einstein examined the issue at the molecular level and found the claim absurd. Not everyone agrees with Einstein, so I suggest AGW proponents do a bit of homework based on their own theory.
Rather than bore you with more mathematics or graphs, I assign you the following homework. Calculate the effect on temperature if all LWIR in the 15 micron band were “absorbed” by CO2 and prevented from escaping to space, the fundamental (if flawed) tenet of the AGW theory. All the data needed to do so are in this article and the linked page above on “comparing energies”. It is a bit tedious but if you do the work yourself you will learn definitively that AGW is a scam and if you don’t do the work you have no basis for accepting the alarmist crap that Justin Trudeau, Catherine McKenna, Jonathan Wilkinson, Steven Guilbeault, or John Kerry spout on a daily basis.
I have marked each of them for a copy of this article and I am confident that none of them will abandon their AGW cult since it is the source of their political power despite its demonstrable flaws.
The importance of electing leaders that eschew the AGW charade can’t be overstated. Trudeau and Biden will continue their attack on fossil fuels until millions of people worldwide are impoverished and permanent damage is done to the Canadian and U.S. economies. The rhetoric is dispensed in doses more toxic than any COVID vaccine and the “booster shots” are daily incidents of shrill propaganda. You owe it to yourself, your children and your grandchildren to put a stop to this dangerous addiction by voting its proponents out of office.


It's much easier to demonstrate AGW is a fraud using the molar mass version of the Ideal Gas Law (IGL). If you calculate the impact of doubling CO2 levels on surface air density, pressure and molar mass, you will conclude that doubling CO2 has no impact on surface temperature. Or to put it differently, if you assume some material temperature increase from doubling atmospheric CO2, then you must be able to show sufficient change in some combination of density, pressure and/or molar mass that is consistent with the IGL. But of course it cannot be done. Therefore climate sensitivity is essentially zilch and AGW is thus refuted.