Chapter Five: Efficient Investing in Inefficient Markets
How big is the sell-side rake?
Since it is undeniable that fund managers, brokers and advisors add nothing to the wealth creating activities of the corporations in whose shares they trade, their revenues are a “tax” on investors or a “rake” on traders. World stock markets have a value of about $90 trillion. The U.S. stock markets comprise about $40 trillion of that.
In terms of dividends and share appreciation, those markets return something less than 10% annually, or about $10 trillion and the United States stock markets a bit less than $4 trillion. In 2021, U.S. corporations in aggregate earned about $2.8 trillion and paid out about $1.8 trillion in dividends.
How much of the $10 trillion went to “leakages” in the form of commissions, fees, MER or percentages of AUM?
The global asset management industry had AUM of $126 trillion in 2021. AUM managed by asset managers exceeds the value of the stock market since many funds manage fixed income securities and derivatives. The data are from my old employer, McKinsey & Company, Inc.
McKinsey reports that revenues for global asset managers totaled $526 billion in 2021. Those revenues to asset managers are costs paid by investors, and comprised about 5.3% of the profits they might otherwise have enjoyed.
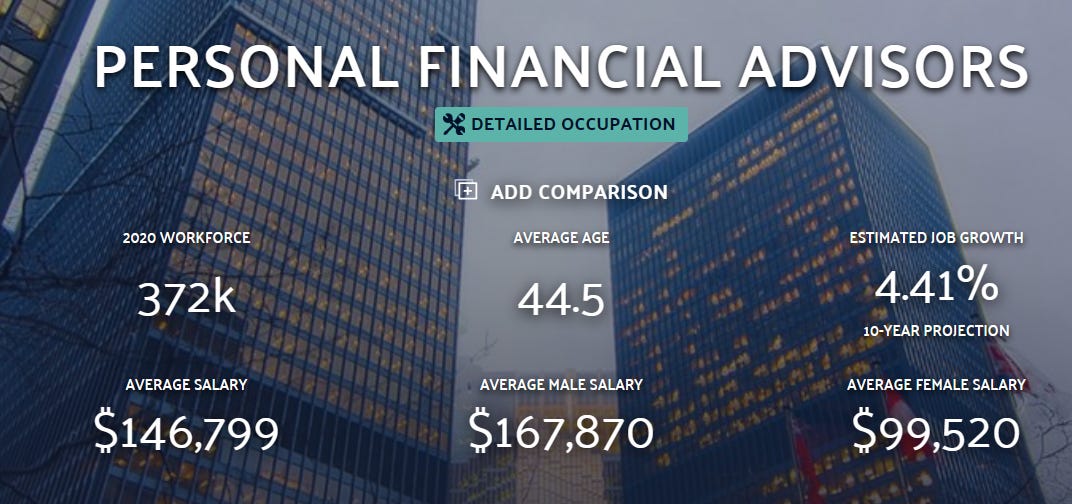
Advisory fees are another form of leakage. There are a reported 372,000 personal financial advisors in United States alone and their average compensation is $147,000. The total cost to investors of these advisors is $147,000 x 372,000 = $57 billion. Since those are only U.S. advisors, their compensation amounts to 1.35% of the $4 trillion of income earned by the companies making up the U.S. stock market.
Another way to get at the “leakage” of profits attributable to owners of public corporations is to look at the revenues of banks from wealth management (a euphemism for advisory fees), asset management (actually managing portfolios) and their capital markets and investment banking segments (a large portion of which is underwriting fees and beneficial to investors, not at their expense). McKinsey reports that these segments totaled $1.1 trillion 2021 - and $858 billion if you exclude the total capital markets and investment banking segments.
Stated simply, at least $858 billion of the $4 trillion profits attributable to the owners of the public companies operating in United States went to banks as financial intermediaries., a staggering 20% plus “rake”.
Without belaboring the point, investors as a class are poorly served by an industry that pretends to assist them but takes at least 20% of their passive investment income for their assistance. The gap between the return on equity of the companies in which they hold investments and the returns they actually get is fully-explained by the costs of financial intermediaries who have “rigged the game” to convince investors they can find “undervalued stocks” and drive investors into the trap of hoping to benefit from higher stock prices, an impossibility when seen in aggregate since paying more for the same future income stream can only result in lower returns.
Aswath Damodaran publishes a wealth of market data on his Stern School website (Damadoran online). Those studying markets or just interested in where to find comprehensive data on both American and global stock markets and sub-segments of those markets will find Damodaran’s site invaluable. One data set is historical returns going back to 1928, a useful reference set for comparing your own investment returns for any particular period that interests you. The data show that $100 invested in the S&P index stocks in 1928 would have produced $624,534.55 by the end of 2022. That comprises a compound annual rate of return of 9.3% for the 94 year period.
Here is the math for that return.
For non-math geeks, calculation of the continuously compounded annual rate of return is simply the natural log of [the ending value ($624,534.55) divided by the beginning value ($100)] divided by the number of annual periods [94].
ln(6245.3455)=8.73959. Divide that by 94 periods to get .0929 or 9.3% (rounded).
Another useful data set provides the “return on equity” for markets. Comparing the return on the S&P to the return on equity for the underlying corporations making up the S&P for any selected period will give you a reasonable inkling of how much of the return the companies in which you own stocks is lost to the “leakage” I have described. Short periods will mislead since there is a lot of volatility in markets related to macroeconomic conditions, interest rates policies, geopolitical factors, inflation, etc. but over a long period this comparison is more robust. You will find tht data support my original claim - that there is a wide gap between what public companies earn and what investors (who are the owners of those companies) actually receive. The long term return on equity for public companies is about 12%.
Stated simply, and at the risk of being repetitive, if the companies investors as a class own are earning ~12% on equity over a long period of time but the investors as a class who own that equity are receiving a return of ~9% on their investments, the gap of ~3% is “leakage” and my explanation of that “leakage” phenomenon points primarily at the fees, commissions and transaction costs of “wealth management”.


